
I had agents running in a sandbox, a lot of questions, and an analytics page that wasn’t enough. So I started poking around.
It started with mild frustration. Several Copilot Studio agents deployed, real users talking to them, and a client asking how they were performing. I opened the built-in analytics page, looked at the resolution rate, looked at the bar chart, and thought: I genuinely don’t know if this is good or not.
There’s no way to filter by agent. No way to drill into a specific conversation. No way to answer “which agent is struggling and why?” without clicking through individual transcripts one by one like it’s a part-time job.
My hunch was simple: the data has to live somewhere. Copilot Studio doesn’t conjure those analytics from thin air. If I could find it, I could build exactly the reporting layer I wanted.
Turns out the data was already there. And the whole thing was buildable in an afternoon — mostly. Let me take you through it.
The Architecture (Or: Four Things You Already Have)
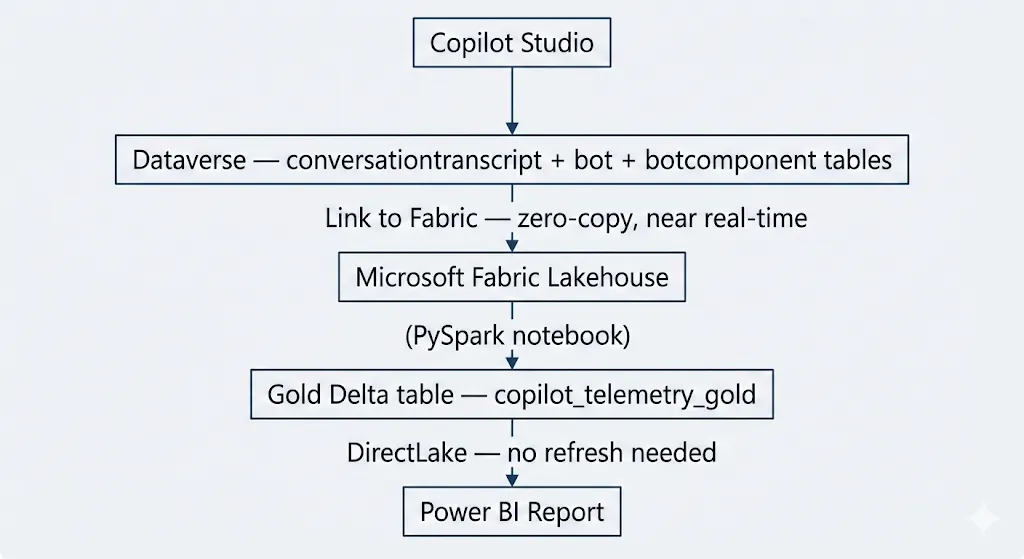
No third-party tools. No export jobs. No Logic Apps polling an API at 3am. Everything is already in your Microsoft tenant — you’re just connecting the dots….
Step 1 — Turn On Transcript Storage
This is the step most people miss, and it will cost you an hour if you skip it.
Copilot Studio stores conversation transcripts in Dataverse automatically — but only if you tell it to. There are two separate settings in the Power Platform Admin Center, and both need to be on:
Go to admin.powerplatform.microsoft.com → your environment → Settings → Product → Features:
- Allow conversation transcript storage — actually saves transcripts to Dataverse
- Allow bot authors to see transcripts — makes them visible in the Copilot Studio UI
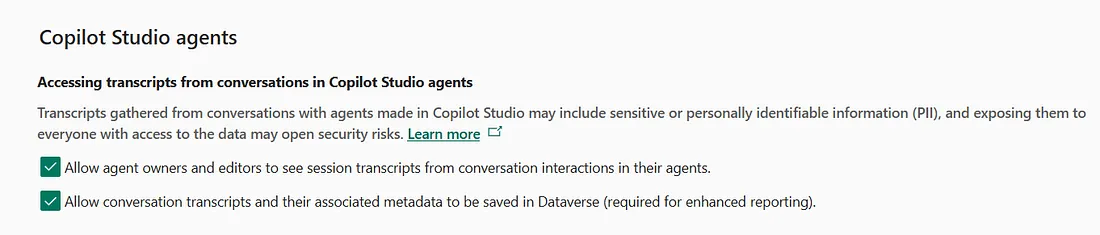
Both need to be on. Having only one on is its own special kind of quiet failure where nothing errors and nothing works.
One more thing: developer environments do not store transcripts. Full stop. If your table is empty and you’re in a developer environment, that’s why. Switch to a production or sandbox managed environment and the rows will start appearing within minutes of a conversation ending.
Step 2 — Link Dataverse to Fabric
With transcripts flowing, the next step is getting them into Fabric without copying anything.
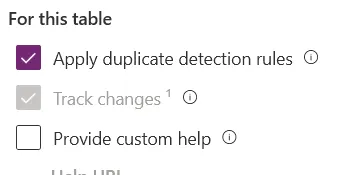
First, enable Track Changes on the tables you want to sync. In make.powerapps.com, go to Tables, open conversationtranscript, then Properties→ Advanced options → Track changes. Do the same for the bot table — you'll need it later for agent names.
Then: Tables → Analyze → Link to Microsoft Fabric
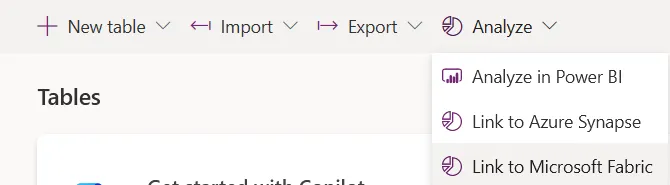
The wizard creates a Lakehouse in your Fabric workspace with Delta shortcuts pointing to your Dataverse data. It looks like a copy but it isn’t — the data stays in Dataverse and Fabric just reads it directly.
One prerequisite: your Dataverse environment region and your Fabric capacity region must be the same. Not just the same geography — the same region. If the Link to Fabric option is greyed out or missing, this is almost certainly why.
Initial sync takes between 15 minutes and 2 hours. Go make coffee.

Step 3 — Understanding the Transcript Data
Before writing any code it’s worth knowing what you’re working with. The content column in conversationtranscript is a JSON string that looks like this:
{
  "activities": [
    { "valueType": "ConversationInfo", "type": "trace", ... },
    { "type": "message", "from": { "role": 1 }, "text": "Hello" },
    { "type": "message", "from": { "role": 0 }, "text": "Hi! How can I help?" },
    { "valueType": "ErrorTraceData", "type": "trace", ... },
    { "valueType": "SessionInfo", "type": "trace", "value": {
        "outcome": "Resolved",
        "outcomeReason": "NoError",
        "turnCount": 4,
        "type": "Engaged",
        "impliedSuccess": true,
        "startTimeUtc": "2026-03-02T09:00:00Z",
        "endTimeUtc": "2026-03-02T09:07:23Z"
    }}
  ]
}
The SessionInfo activity — always the last element — contains everything you need for KPI reporting. Outcome, turn count, duration, implied success. One activity, all the numbers.
role: 1 is the user. role: 0 is the bot. ErrorTraceData activities are errors you can count per conversation.
Step 4 — The Fabric Notebook
Create a new notebook in your Fabric workspace and attach the Lakehouse (not the SQL analytics endpoint — different thing, different icon) before running anything.
A few things that will save you time:
The Lakehouse name is the schema. In Fabric’s spark catalog, you don’t use database.schema.table. The Lakehouse name itself is the schema:
SCHEMA = "your_lakehouse_name_here"
df_raw = spark.sql(f"SELECT  FROM `{SCHEMA}`.conversationtranscript")
Use spark.sql(), not spark.read.format("delta").load(). The Lakehouse shortcuts aren't native Delta tables — reading them via direct path fails. spark.sql() handles it correctly.
Declare value as a string in your schema. The value field inside each activity has a completely different structure depending on the activity type. If you try to define it as a typed struct, Spark's from_json will silently return nulls for every activity that doesn't match. No error. Just nulls. Everywhere. Define it as StringType() and extract sub-fields with get_json_object afterwards.
Here’s the full notebook — paste this as a single cell and run it top to bottom, i did the struggle with the notebook so you don’t have to, with some help here and there..
https://github.com/ldecuba/copilotstudiotelemetry/tree/main/copilot-studio-telemetry/notebook
When it finishes, you have a clean Delta table with 25 columns covering everything you need for reporting. Schedule the notebook to run hourly and you never have to touch it again.
Step 5 — Power BI
From the Lakehouse, click New semantic model and select copilot_telemetry_gold. This creates a DirectLake model — Power BI reads the Delta files directly, no import, no scheduled refresh.
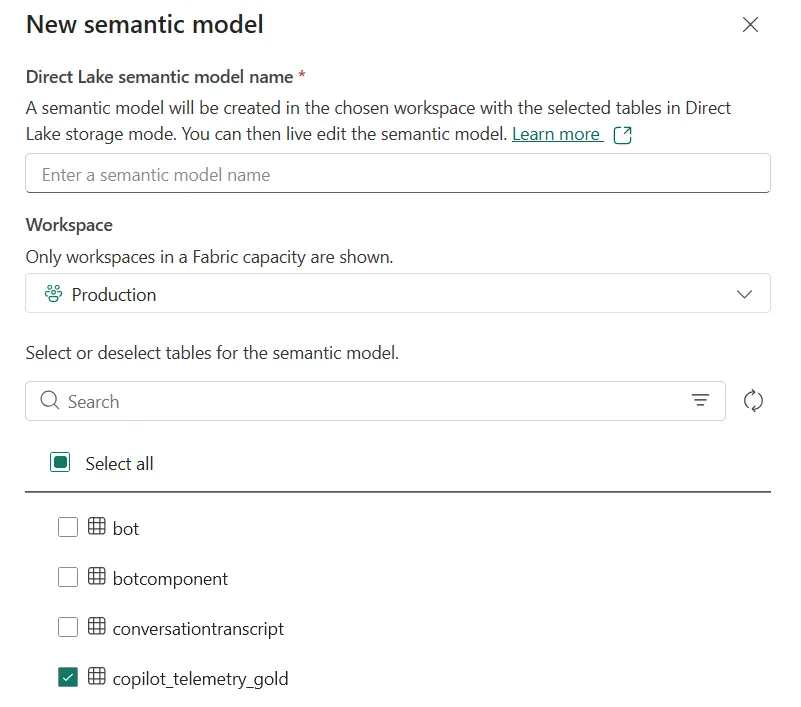
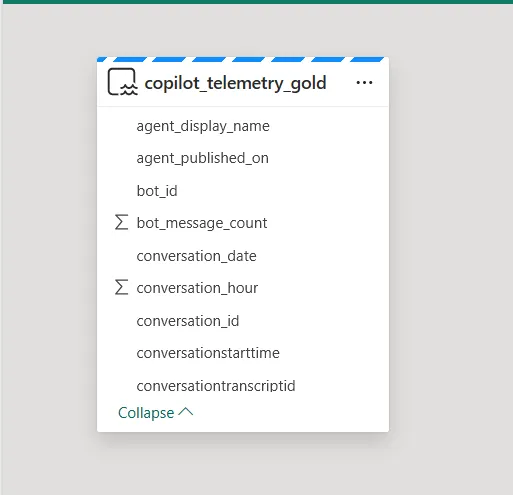
Add these DAX measures:
Total Conversations = COUNTROWS(copilot_telemetry_gold)
Resolution Rate % =
DIVIDE(SUM(copilot_telemetry_gold[was_resolved]), [Total Conversations]) 100
Escalation Rate % =
DIVIDE(SUM(copilot_telemetry_gold[was_escalated]), [Total Conversations]) 100
Avg Turn Count = AVERAGE(copilot_telemetry_gold[turn_count])
Avg Duration (min) = AVERAGE(copilot_telemetry_gold[duration_minutes])
Error Rate % =
DIVIDE(SUM(copilot_telemetry_gold[had_error]), [Total Conversations]) 100
Then build three pages:
Page 1 — Executive Overview: Four KPI cards (Total Conversations, Resolution Rate %, Escalation Rate %, Avg Turn Count), a column chart of conversations over time by conversation_date, and a donut chart of outcome_category.
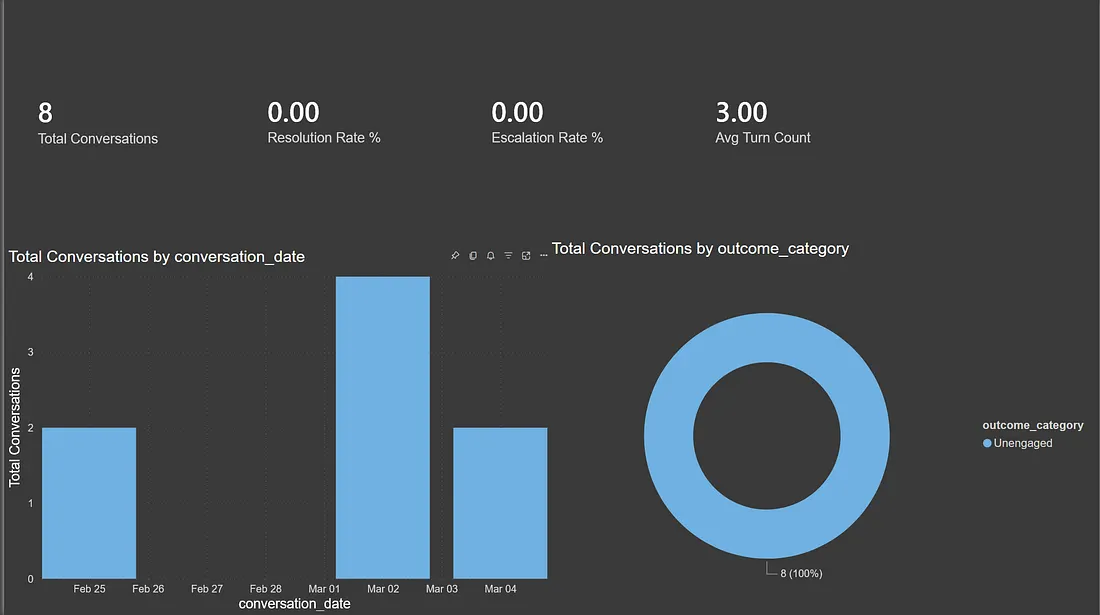
Page 2 — Conversation Quality: A stacked column chart of outcomes over time, a matrix with agent_display_name as rows and outcome_category as columns, and a detail table with conversation_date, agent_display_name, session_outcome, turn_count, duration_minutes.
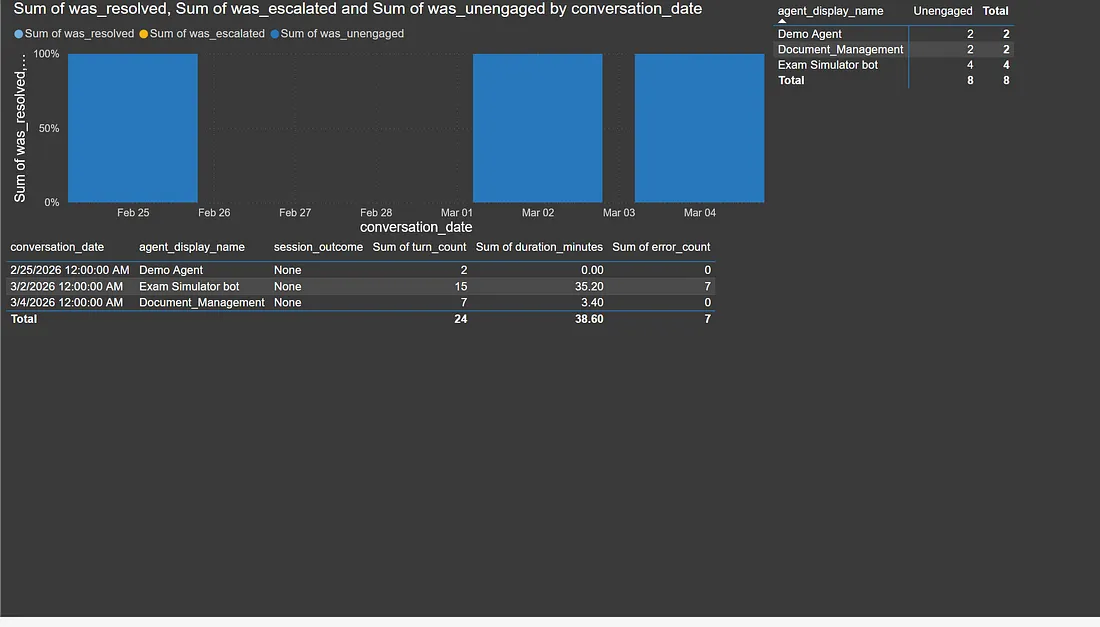
Page 3 — Errors: Cards for Error Rate % and Escalation Rate %, a bar chart of error_count by agent_display_name, and a drillthrough table of problem conversations.
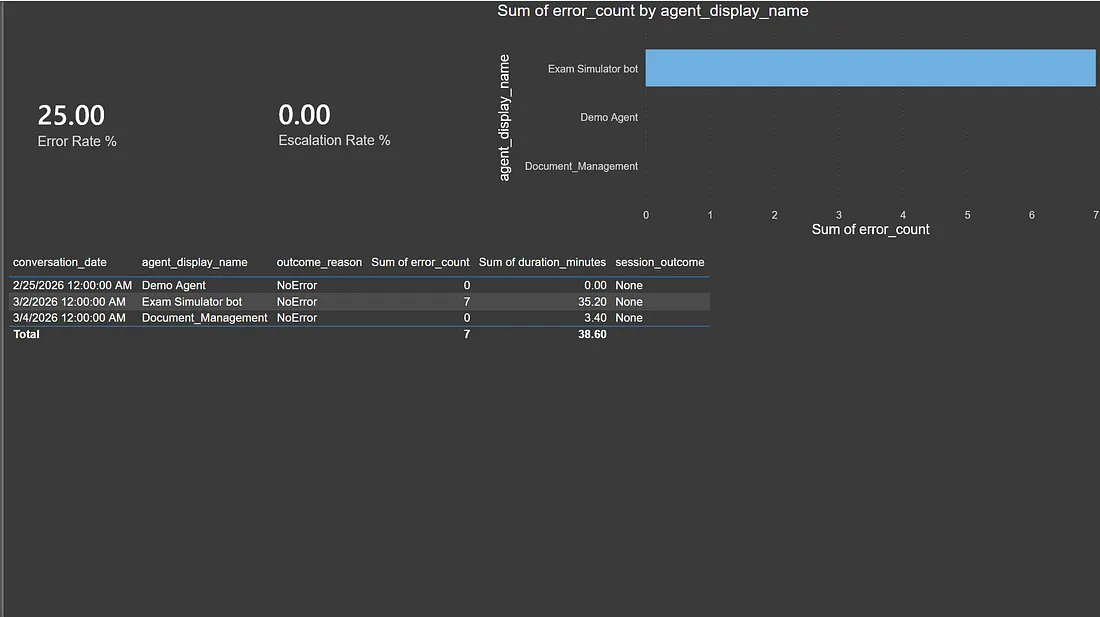
I build this demo for this post so not much data yet but eventually it will fill up so you can use it to your benefit.
What You End Up With
A dashboard that answers the questions the built-in analytics can’t. Which agent has the highest error rate? Which conversations should be reviewed? How does duration differ between agents? What’s the trend in unengaged sessions?
And any new agent you deploy to the environment shows up automatically once it has conversations. No schema changes, no notebook edits, nothing.
The best part: I forgot about it for three days after setting it up and came back to fresh data. That’s really all you want, fully automated.